

In Excel Modelling for Finance, students will develop their finance skills by creating practical business models, forecasts, budgets, scenarios, and decision-making tools from raw data and business assumptions. Finance teams rely on a good model every day, not just for number crunching, but because it brings revenue, cost, working capital and cash together in one working framework. This article walks through a step-by-step approach to Excel modelling for finance, covering the techniques, statement analysis, budgeting, and scenario skills that underpin the role.
What Is Excel Modelling in Finance?
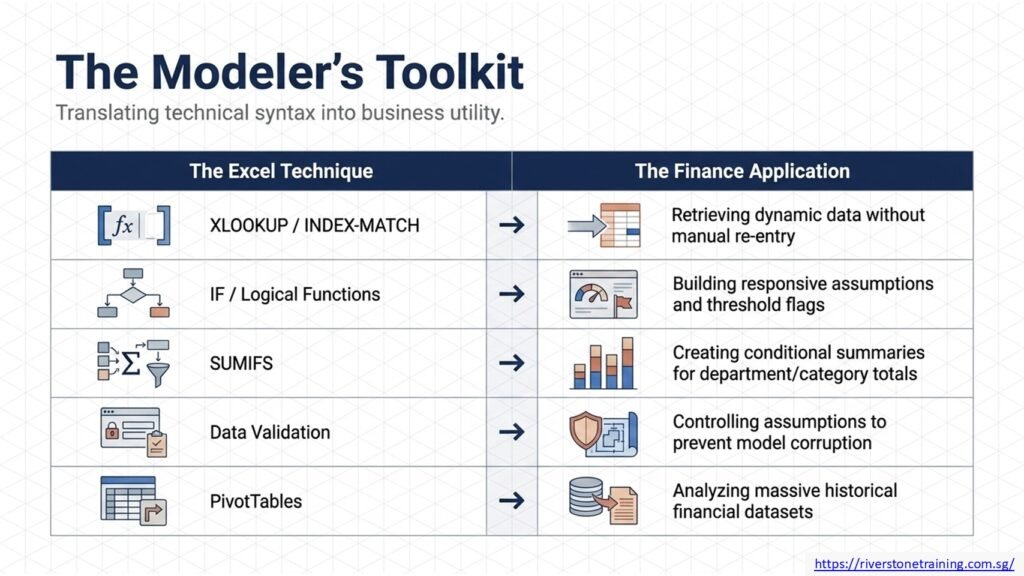
In finance, Excel modelling involves structuring assumptions, calculations, financial statements, forecasts, and outputs into a single, connected model using the spreadsheet Excel. A model allows the user to connect revenue drivers, cost assumptions, working capital and financing decisions, so that if a user tweaks one of the inputs, the rest of the model is automatically recalculated. It’s relevant to building revenue forecasts, building expense forecasts, building income statements, building balance sheets, building cash flow forecasts, building budgets, ratio analysis and scenario/sensitivity testing.
More than just knowing individual functions, effective Excel modelling for finance is knowing how to use them. A professional also has to have an understanding of the underlying financial concepts, business drivers and accounting relationships that are being modelled, how to set up the model, how to document assumptions and add quality checks so that the output of the model can be trusted.
| Excel Technique | Finance Application |
| Formulas | Financial calculations |
| XLOOKUP | Retrieving financial data |
| IF Functions | Building conditional logic |
| PivotTables | Analyzing financial data |
| Data Validation | Controlling assumptions |
| Charts | Communicating financial results |
How Does Excel Modelling Build Practical Finance Skills?
Creating a model from the ground up involves the professional having to go through a series of steps that are similar to what the professional would do in a real job in finance: collect data, make assumptions, develop calculations, and verify that the results are sensible. This process builds financial understanding on top of Excel expertise because each formula must represent a real-life financial connection, like an increase (decrease) in payment terms changing receivables and cash.
This is repeated again and again, and over time, these transferable finance skills develop: forecasting, financial statement analysis, budgeting, and scenario planning—skills that can be used in a variety of roles and industries. The ability to build and interpret models independently is a skill that can be very advantageous in any finance team and is a skill that a professional will have.
Which Excel Techniques Are Important for Financial Modelling?
Understanding cell references and the difference between relative and absolute references is crucial, as it helps to ensure that a formula reflects changes when it’s moved or pasted across a model. SUM and SUMIFS can be used to add up totals based on conditions, for instance, the total costs by department; IF statements and other logical functions can be used to automatically flag a model when assumptions change, for instance, the model can flag when cash is below a minimum threshold.
XLOOKUP and INDEX/MATCH are used to obtain relevant data from supporting schedules, such as obtaining a particular cost rate from a forecast without having to retype it, thus preserving model consistency and minimizing manual errors. Date functions ensure that time periods remain constant, PivotTables and charts enable the analysis and communication of results, and data validation, named ranges, and error checks ensure the accuracy and usability of the final model without being a technical add-on.
How Does Excel Modelling Improve Financial Forecasting?
Financial forecasting in Excel is the process of linking assumptions (revenue growth, sales volume, price, cost inflation, working capital, capital expenditure, depreciation, debt, interest expenses, etc) to forecast outputs (profit, cash, etc). These assumptions are stored once and used in the model at multiple points, so that any change to one driver will automatically result in the corresponding change to all the other drivers used in the model, maintaining the consistency of the model.
For instance, if a company anticipates an 8% rise in sales volume, that also means a corresponding rise in revenue and cost of goods sold (COGS), which in turn means gross profit, as well as an increase in accounts receivable (if they aren’t paid on the day), which affects operating cash flow and ultimately the ending cash balance. It’s helpful to have this organized in an Excel spreadsheet so you can see the entire chain of impact on one sheet – instead of having to do a bunch of manual recalculations.
How Can Excel Models Support Financial Statement Analysis?
A model in Excel can be used to connect the income statement, balance sheet and cash flow statement together, so that a change in one area reflects a change in the other areas. Income statement: Looking at revenue on the income statement to gross profit, operating expenses, EBITDA, EBIT and net income; Cash on the balance sheet, receivables, inventory, fixed assets, debt and equity.
The cash flow statement then reconciles these two, dividing the cash flow into operating, investing, and financing components, to arrive at free cash flow. Creating these links in Excel allows a finance person to perform basic finance modelling skills, like determining that an increase in inventory leads to a decrease in the operating cash flow, even though it’s not recorded on the income statement.
How Does Excel Modelling Help With Budgeting?
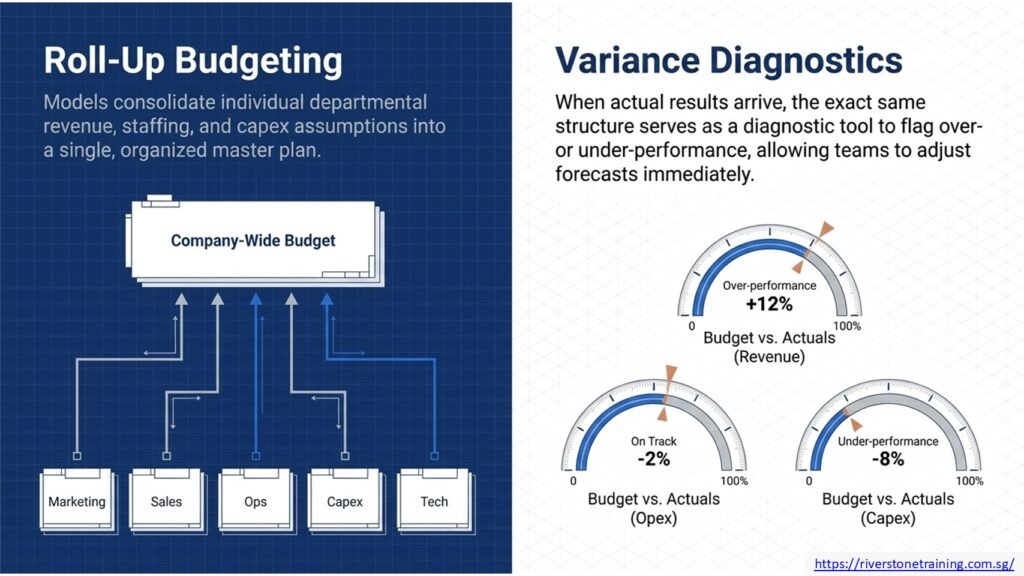
Excel models can be used to budget because they can contain all the departmental revenue and expense budgets, assumptions for staffing, and planned capital expenditure programs as a single, organized, and roll-up company-wide budget. A cash budget could be created similarly, and it shows the inflows and outflows over the period being budgeted.
When actual results are available, the same structure can be used to complete variance analysis, which will compare budget and actual performance to the forecast, indicating areas of over- or under-performance. This comparison will enable finance professionals to see which areas need to be managed, for example, a department always exceeding budgets, and adjust the forecast accordingly.
How Can Scenario Analysis Strengthen Finance Skills?
Because there are rarely times in business when things are black and white, scenario analysis is a great asset to finance skills, and a structured Excel model enables professionals to experiment with various scenarios and determine the likely impact before the scenarios occur in reality. A base case will be what is expected, an upside case may be higher revenue growth or higher margins, and a downside case may be lower sales, higher costs, or slower customer collections.
In the model, the scenario changes all of the above and links assumptions to revenue, profitability, cash flow, working capital, debt, liquidity, and key financial ratios, so that if you change the scenario, all these are calculated together. By doing this over and over, they will develop the judgment that will help them to see through a variety of results instead of just a single one that might be overly optimistic.
| Scenario | Revenue | Costs | Expected Result |
| Base | Expected | Expected | Planned outcome |
| Upside | Higher | Controlled | Stronger profitability |
| Downside | Lower | Higher | Weaker cash generation |
Why Are Structured Excel Models Important for Finance Professionals?
A structured model is important because it should allow anyone looking at it to see what’s changed, why it changed, and what the financial consequences were, without having to look at each formula individually. This requires distinct input and output spaces, uniform formatting, logical order of calculations, correlated schedules, clear formulas, and uniform time periods across.
It’s also important to avoid unnecessary hard coding and make the assumptions easily changeable, for in practice, a model that needs to be rebuilt whenever an assumption changes is far less useful. It is not just good Excel practice, but a fundamental component of financial professionalism to build into all models.
How Does Excel Modelling Improve Business Decision-Making?
Finance professionals can compare alternatives side by side and make decisions like hiring, pricing, capital expenditure, investment, expansion, cost reduction, financing, budget allocation, and cash management without depending on mere intuition when using Excel models. A model may demonstrate, for instance, the cash effect that can be expected from employing five extra workers, versus a delay of two quarters.
Just note that the model does not make the decision automatically; it offers structured financial information, including expected profit, cash needs, and risk across various scenarios, to help you look at the trade-offs and make a better decision.
How Can Excel Models Help Professionals Analyze Financial Data?
Aside from creating forecasts, Excel can be used to analyse past and present financial information, for example, using PivotTables to summarise large amounts of data by category and charts to visualise trends, which can be shared with stakeholders who don’t want to look at raw data. Financial ratio analysis can be computed and monitored directly in the model, such as gross margin, EBITDA margin, or working capital turnover.
This makes it much more than a forecasting tool, as the same process for creating a forecast can be used to come to an understanding of what has already occurred in the business and why performance shifted in a given direction.
What Excel Skills Should Finance Professionals Develop?
In addition to the basic formulas, finance professionals need to be familiar with SUMIFS to create a conditional summary, IF and other logical functions to create a responsive assumption, and XLOOKUP or INDEX/MATCH to extract data from supporting schedules without having to re-enter it manually. Data validation can be used to limit the data that can be entered into an assumption cell, in order to avoid having an unrealistic assumption cell input destroy the model.
Conditional formatting and charts emphasize results and visually communicate them, and PivotTables enable faster analysis of more extensive data sets. In addition to these technical skills, practitioners should also become accustomed to adding error checks, such as a check for a balanced balance sheet, which makes a model reliable, rather than simply useful.
| Skill | How Excel Modelling Develops It |
| Forecasting | Building forward-looking assumptions |
| Analysis | Interpreting financial data |
| Budgeting | Creating and monitoring financial plans |
| Scenario Planning | Testing different outcomes |
| Decision-Making | Comparing financial alternatives |
How Can Financial Modeling Training Improve Excel Modelling Skills?
Structured training allows the student to go beyond individual Excel functions and integrate a practical workflow of Excel skills and techniques, along with concepts, financial statement analysis, financial forecasting, and scenario analysis. Case studies and model-building exercises can be especially helpful here because they reveal how the choice of a formula is related to a real financial result, not just suggest that there is such a thing as a “magic” Excel function.
A structured financial modeling skills course Australia can guide learners through this progression step by step, from building basic assumptions to constructing linked schedules and complete forecasts, which is difficult to replicate through self-directed practice alone since errors in a model are often only visible once the full structure is built and tested.
How Can Excel Modelling Support Career Readiness in Australia?
The ability to use Excel modelling that is found in the financial analyst role is applicable in other finance roles in Australia, such as financial analyst, FP&A analyst, management accountant, corporate finance analyst, investment analyst, business analyst, finance manager, and commercial analyst. With all of these roles, you should be able to do the same thing – translate data and assumptions into a structured forecast, budget, or analysis to inform a business decision.
Employers might prefer to see people who not only know how to use Excel, but also how the model’s financial logic works: you can build a correct model the first time, and communicate your assumptions with others. It is a mistake to think that just teaching someone the technical aspects of using Excel for finance is sufficient – it is equally important to teach them the conceptual aspects to prepare them for the range of roles that the software is used in.
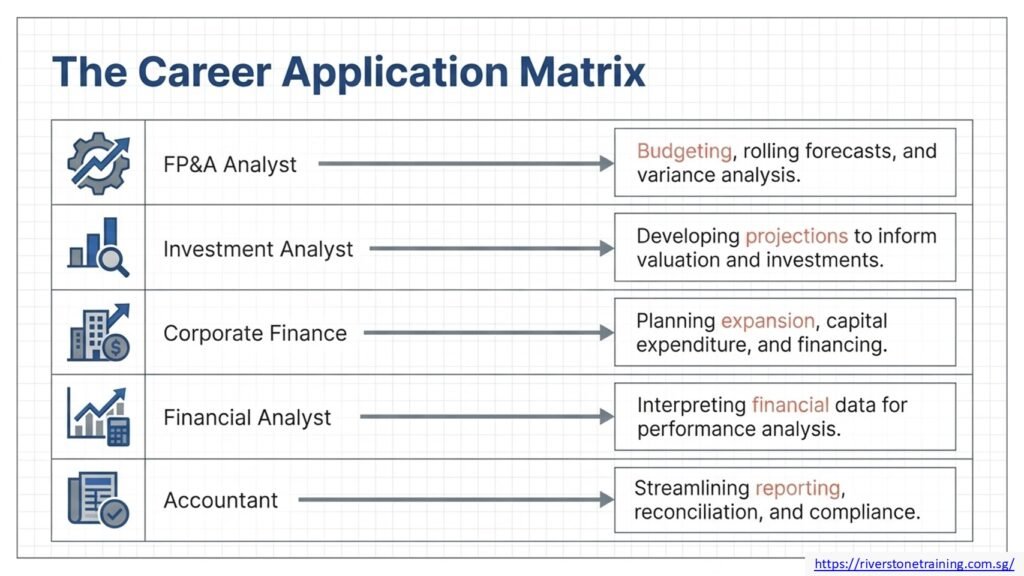
| Finance Role | Excel Modelling Application |
| FP&A Analyst | Budgeting and forecasting |
| Financial Analyst | Financial analysis |
| Corporate Finance | Planning and decision support |
| Investment Analyst | Financial and investment analysis |
| Accountant | Reporting and financial analysis |
Which Finance Roles Benefit From Excel Modelling Skills?
FP&A analysts use Excel modelling to make budgeting, rolling forecasts, and variance analysis calculations; financial analysts use it for performance analysis; and investment analysts use it to develop projections and inform valuation or investment decisions. Models are used by corporate finance professionals to plan and inform financial decisions like financing or expansion.
There are also benefits for accountants and management accountants, who then use Excel to assist with reporting, reconciliation, and financial analysis, in addition to their compliance duties. In all of these roles, the common skill is the ability to present financial data in a structured manner and relate the assumptions to the results – the fundamental skill that EXCEL modelling for finance builds.
How Can Professionals Build Stronger Excel Modelling Skills?
The development of new skill levels begins with the practice on realistic business scenarios; not only isolated exercises, but the modelling of a new business location from initial investment and expected customers through to revenues, employee costs, rent, marketing, working capital, loans and financing, and the resulting cash flow. It is helpful to work through this case end-to-end to see how each assumption relates to profitability and cash needs and what impact altering one input (like the number of customers) will have on the overall landscape.
Several steps are taken to bridge the gap in knowledge between just being able to use Excel and being able to use it for actual financial modelling by looking at completed models, getting feedback on the structure and assumptions, and deliberately practicing techniques like scenario and sensitivity analysis with real data. This type of structured learning through practice is usually more beneficial than merely learning the Excel functions without putting them into practice with a financial model.
| Modelling Area | Example |
| Revenue | Sales volume x price |
| Expenses | Cost assumptions |
| Working Capital | Receivables and inventory |
| Capex | Asset investment |
| Debt | Borrowing and repayment |
| Cash Flow | Operating, investing, financing |
Conclusion
The ability to use Excel as a tool to model data is a skill that develops finance skills as it requires finance professionals to integrate technical skills in using Excel with financial thinking, forecasting, statement analysis, budgeting, scenario planning and business decision-making in a cohesive model. While knowledge of formulas is a key part of Excel modelling for finance, a strong understanding of how assumptions, financial statements, business drivers and outputs are connected to each other is the key to Excel modelling for finance.
Professionals can fill the gap between the knowledge of simple tools such as Excel and real financial modelling skills through structured training and practical experience using real business scenarios, including a specific financial modeling skills course that can be attended in Australia where relevant. This is a key opportunity for finance professionals to become more career-ready by enhancing their financial skills and expertise in Excel.
Finance Excel modelling is the use of Excel to structure assumptions, calculations and financial statements into a coherent, interconnected model. It enables professionals to create forecasts, budgets, and scenario analysis within a single platform, which means that altering an assumption automatically updates the outputs, such as profit and cash flow.
More than just a spreadsheet, Excel is a valuable tool because it allows professionals to connect assumptions, computations, and financial statements in one place, instead of dealing with static, stand-alone numbers. This enables different scenarios to be tested, a variety of interactions between the different inputs to be explored, and models to be developed that can be readily updated as business situations evolve.
The basic formulas, conditional formulas (SUMIFS, IF), lookup (XLOOKUP, INDEX/MATCH), data validation, and data tools (PivotTables, charts) should be taught to finance professionals. Just as important, however, is knowing the reasons why these techniques work and how they relate to the business world, and not just to a calculation; formulas are a reflection of real business relationships.
The benefit of Excel modelling is that you can directly link assumptions (e.g., revenue growth or cost inflation) to the forecasting outputs (e.g., profit or cash flow). Since the model is automatically recalculating, professionals can benefit from viewing the entire effect of a single assumption change on both the revenue, working capital, and cash.
Yes. The Excel models streamline budgeting, meaning they can organize revenue, expense and capital budgets and compare with actuals to forecast. The same structure is used for scenario analysis, which enables professionals to create base, upside and downside scenarios and see how they affect profitability, cash flow and liquidity.
Australian professionals can overcome the limitations of individual Excel skills and develop a structured financial modelling course, and become more capable with modelling. Assumptions, financial statements and outputs are interconnected, and this is more challenging to teach using self-study materials; guided practice using case studies and realistic business scenarios provides learners with an understanding of this.